
The PCE price deflator confirmed inflation remains a strong challenge for the U.S. economy, rising 0.6% last month and 5.7% in the last 12 months. The annual increase was the highest since 1982. Core PCE inflation rose 0.5%, suggesting food and energy prices rose only slightly more than broad consumer prices (Figure 1).
Key Points for the Week
- The personal consumption expenditures (PCE) price deflator rose 0.6% and is up 5.7% in the last 12 months. The annual increase in the PCE inflation rate is the highest since 1982.
- The housing market remains tight. Existing homes sales increased 1.9% and the supply of existing homes for sale decreased 13%.
- Market volatility has picked up in recent weeks as adjustments to Fed policy and the Omicron variant caused a spike in 1% moves in the S&P 500.
Prices have risen rapidly in the housing market. Existing home sales increased 1.9% last month and supply dropped 13%. The median price for an existing home rose to $354,000 and the median price for a new home is now $417,000.
Stocks remain volatile. The S&P 500 moved by 1% more often in the past four weeks than in any other four-week period this year. Fortunately, the moves were primarily to the upside. The S&P 500 index added 2.3% last week and eclipsed the previous all-time high. The MSCI ACWI gained 2.0%. Bond yields rose and bond prices fell. The Bloomberg U.S. Aggregate Bond Index surrendered 0.4%. Data releases are light this week as the PCE data came out one week early.
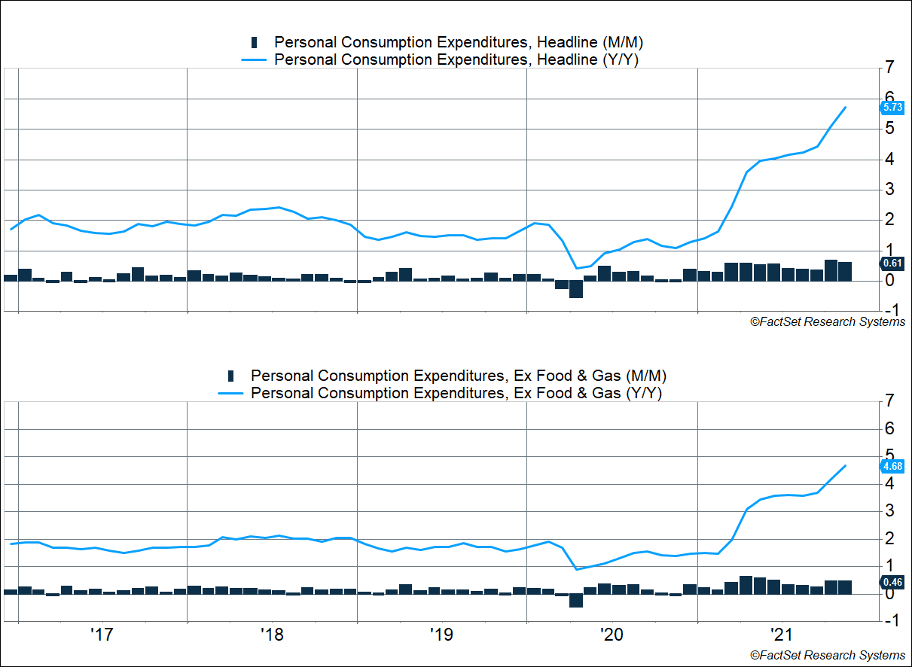
Figure 1
Did You Get My Letter?
Santa isn’t the only one who gets letters this time of year. During this holiday week, we’ll answer a couple of the questions we’ve received about how the market is responding to the current environment.
Will the market go down or get more volatile because rates are rising?
The Federal Reserve normalizing rates can increase risk and volatility. Recent history suggests rate hikes don’t have as much immediate impact as we might think. The last time the Fed reversed direction and increased rates was 2015, with a single hike in December. It waited another 12 months for the next hike in December 2016 and then hiked rates three times in 2017 and four times in 2018. S&P 500 returns were a little below average during those four years, with stocks rising about 7% per year. In 2017 the market earned more than 20%, and the S&P 500 had a mere eight moves of more than 1%. The 2004-2006 period included 18 interest rate hikes; yet, stocks fared decently. Returns were similar to the most recent rate-hike cycle, rising 6.6% each year.
In both cases the rate hikes had to be at least partially reversed. Signs the economy was slowing precipitated three rate cuts in 2019. The Fed cut rates again to support the economy during the COVID-19 pandemic. Rates were very low in 2004 because they had been cut to support the economy as the technology bubble unwound. Rates likely got too low and led to speculation in the housing market and contributed to the global financial crisis.
We counsel patience during periods like this one:
- Returns are likely to slow after three straight years of nearing or topping 20%. But in the last two cycles, investors who pulled out of the market when rates were first hiked and reinvested at the last hike missed out on about 70% of returns.
- This rate-hike cycle will likely have fewer hikes than the last two. In 2006 rates peaked at 5.25%. Rates only reached 2.5% in 2018, and the Fed expects that to be in line with long-term rates. We are less optimistic about the economy and think the Fed will raise rates slowly and not above 2%.
Why do the CPI and PCE price deflator show a gap of more than 1%?
The Consumer Price Index or, more technically, the CPI for All Urban Consumers (CPI-U) and Personal Consumer Expenditures Price Index both measure inflation but use different methodologies. Each measure also has a “core” version that excludes food and energy price changes. The Federal Reserve prefers to use the core PCE inflation index, and we align with its thinking for the following reasons:
- Food and energy prices are more volatile and often don’t reflect price trends in the broader economy.
- The PCE index adjusts the weight of various items more quickly based on changing consumer behavior than the CPI index. The PCE inflation index also allows for substitutions consumers make when the price of a good increases, better reflecting consumer behavior.
- The PCE index includes expenditures made on the behalf of consumers by insurance companies or the government. This also reduces the impact of housing prices on the PCE compared to the CPI.
However you measure it, the high inflation rate has been reducing benefits that would normally accrue to workers, an important point to note in this season of giving. The Fed’s tighter money supply combined with less federal spending and the normal workings of capitalism should start to push the inflation rate lower soon.
–
This newsletter was written and produced by CWM, LLC. Content in this material is for general information only and not intended to provide specific advice or recommendations for any individual. All performance referenced is historical and is no guarantee of future results. All indices are unmanaged and may not be invested into directly. The views stated in this letter are not necessarily the opinion of any other named entity and should not be construed directly or indirectly as an offer to buy or sell any securities mentioned herein. Due to volatility within the markets mentioned, opinions are subject to change without notice. Information is based on sources believed to be reliable; however, their accuracy or completeness cannot be guaranteed. Past performance does not guarantee future results.
S&P 500 INDEX
The Standard & Poor’s 500 Index is a capitalization-weighted index of 500 stocks designed to measure performance of the broad domestic economy through changes in the aggregate market value of 500 stocks representing all major industries.
MSCI ACWI INDEX
The MSCI ACWI captures large- and mid-cap representation across 23 developed markets (DM) and 23 emerging markets (EM) countries*. With 2,480 constituents, the index covers approximately 85% of the global investable equity opportunity set.
Bloomberg U.S. Aggregate Bond Index
The Bloomberg U.S. Aggregate Bond Index is an index of the U.S. investment-grade fixed-rate bond market, including both government and corporate bonds.
https://www.bls.gov/news.release/cpi.nr0.htm
https://www.federalreserve.gov/monetarypolicy/openmarket.htm;
https://www.upmyinterest.com/sp500/
https://www.federalreserve.gov/monetarypolicy/files/fomcprojtabl20211215.pdf
https://www.bea.gov/news/2021/personal-income-and-outlays-november-2021
https://www.nar.realtor/research-and-statistics/housing-statistics/existing-home-sales
https://www.census.gov/construction/nrs/pdf/newressales.pdf
Compliance Case #01224524
