
Equity markets have given back some of last year’s gains. Higher interest rates appear to be the major cause. As the Federal Reserve prepares for its first meeting of the year, investors have raised the odds of four interest rate hikes to approximately 70% from less than 30% one month ago (Figure 1). Fed Chair Jerome Powell’s press conference after the meeting will likely be scrutinized for further guidance concerning interest rates.
Key Points for the Week
- Equity markets continued to decline; the S&P 500 has fallen 7.7% in 2022.
- Single family housing starts dipped 2.3% while remaining at high levels.
- Chinese industrial production rebounded, but retail sales were below expectations because restaurant spending was down.
Higher interest rates and prices seem to be slowing the housing market. Single family housing starts dipped 2.3% while remaining elevated. Existing home sales also slowed, down 4.6%. The median price of an existing home increased 15.8% last year. Record low inventory contributed to the decline. Apartments may be the answer for some people. Multifamily starts jumped 13.7%.
Chinese retail sales increased only 1.7% versus expectations of 3.7%. The weak retail recovery in China can be attributed to sluggish restaurant spending, which dropped 2.2%. While Chinese consumers aren’t buying as much as expected, factories continue to produce goods for trade. Industrial production rose 4.3% in the last 12 months, and auto production was a positive driver for the first time since April.
The S&P 500 index sank 5.7% last week and is down 7.7% for the year. Global stocks have held up a little better. The MSCI ACWI dropped 4.2% last week and is 5.5% lower for the year. The Bloomberg U.S. Aggregate Bond Index was basically unchanged and is off 1.8% year-to-date. The Fed meeting heads the major economic and policy releases this week.
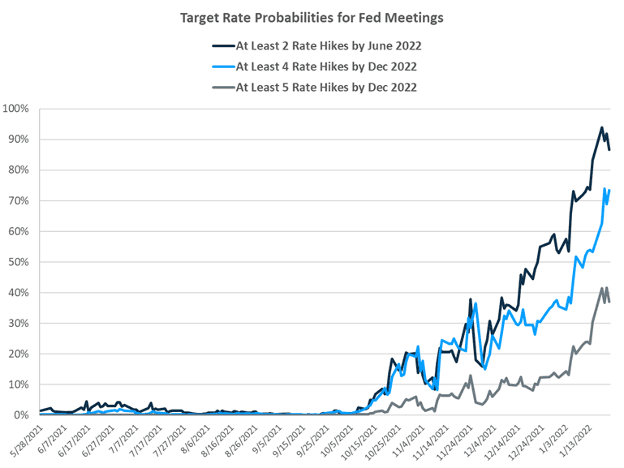
Figure 1 (Source CME Fedwatch and Carsong Group Calculations)
Volatility Returns
The market volatility we have been warning about finally surfaced last week. After a couple slight declines, the S&P 500 dropped 5.7% and is now down 7.7% for 2022. The losses have primarily been concentrated in growth stocks, which tend to grow more rapidly than value stocks and often trade with higher valuations. The Russell 1000 Value has fallen 3.6%, while its counterpart, the Russell 1000 Growth, has declined 12.2% this year.
Increasing interest rate expectations are a top factor pressuring markets. Higher interest rates can cause challenges for markets in different ways. Higher rates reduce the value of future earnings. Interest rates are part of the equation used to compute the value of future earnings in today’s dollars. The more interest rates are expected to increase, the less future earnings are worth, and that pressures stock prices. Growth stocks often expect more earnings in the future and can be vulnerable to changes in rates.
Not only may future earnings be worth less, but they can also be reduced. Higher rates diminish profitability by raising the interest payments on corporate debt and reducing the profit earned. Higher rates also make it more expensive for investors to borrow against their portfolios, forcing some leveraged investors to reduce positions. Higher rates make bonds more competitive with stocks, causing some investors to reduce their allocations to stocks.
Another challenge has been keeping up with earnings expectations. By the time firms finish reporting last year’s results, earnings will have likely increased more than 50%. But some companies were aided by large levels of government spending. Others benefited from people staying at home more often. Increased competition and pressure on margins may challenge future outlooks. In a market in which the S&P 500 has returned more than 16.5% per year for a decade, some stocks have high expectations that leave investors disappointed and prices lower.
None of this means investors should hop out of the market. It is an old adage in markets that as January goes, so goes the year. The recent track record for this adage is abysmal. The S&P 500 has declined in January five times in the last 10 years. In every case, the S&P 500 has finished the year higher.
What we are experiencing is not strange. Ten percent declines in the S&P 500 are a regular occurrence. Since 2000, the S&P has declined by more than 10% in nine years. Given that the Fed is pivoting its interest rate policy relatively quickly, higher volatility shouldn’t come as a big surprise.
–
This newsletter was written and produced by CWM, LLC. Content in this material is for general information only and not intended to provide specific advice or recommendations for any individual. All performance referenced is historical and is no guarantee of future results. All indices are unmanaged and may not be invested into directly. The views stated in this letter are not necessarily the opinion of any other named entity and should not be construed directly or indirectly as an offer to buy or sell any securities mentioned herein. Due to volatility within the markets mentioned, opinions are subject to change without notice. Information is based on sources believed to be reliable; however, their accuracy or completeness cannot be guaranteed. Past performance does not guarantee future results.
S&P 500 INDEX
The Standard & Poor’s 500 Index is a capitalization-weighted index of 500 stocks designed to measure performance of the broad domestic economy through changes in the aggregate market value of 500 stocks representing all major industries.
MSCI ACWI INDEX
The MSCI ACWI captures large- and mid-cap representation across 23 developed markets (DM) and 23 emerging markets (EM) countries*. With 2,480 constituents, the index covers approximately 85% of the global investable equity opportunity set.
Bloomberg U.S. Aggregate Bond Index
The Bloomberg U.S. Aggregate Bond Index is an index of the U.S. investment-grade fixed-rate bond market, including both government and corporate bonds.
Russell 1000 Growth
The Russell 1000® Growth Index measures the performance of the large cap growth segment of the US equity universe. It includes those Russell 1000 companies with relatively higher price-to-book ratios, higher I/B/E/S forecast medium term (2 year) growth and higher sales per share historical growth (5 years).
Russell 1000 Value
The Russell 1000® Value Index measures the performance of the large cap value segment of the US equity universe. It includes those Russell 1000 companies with relatively lower price-to-book ratios, lower I/B/E/S forecast medium term (2 year) growth and lower sales per share historical growth (5 years).
https://www.census.gov/construction/nrc/pdf/newresconst.pdf
https://www.nar.realtor/newsroom/annual-existing-home-sales-hit-highest-mark-since-2006
https://www.cnbc.com/2022/01/17/china-economy-gdp-for-december-and-full-year-2021.html
Compliance Case #01252587
